Product Info
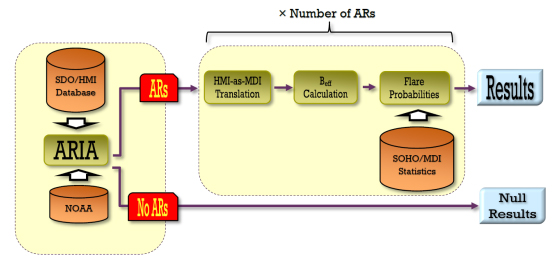
Derivation of flare probabilities relies on the calculation of the effective connected magnetic field strength (Beff), introduced by Georgoulis & Rust (2007) and revised by Georgoulis (2011; 2013), that quantifies the strength of Polarity Inversion Line(s) in an active region’s photospheric or chromospheric magnetogram. Only the normal field component is required for the calculation. A schematic overview of the work flow for the A-EFFort service is presented in the following figure.
Below we present the products of the A-EFFort service with a brief description concerning their derivation.
Image with eligible ARs
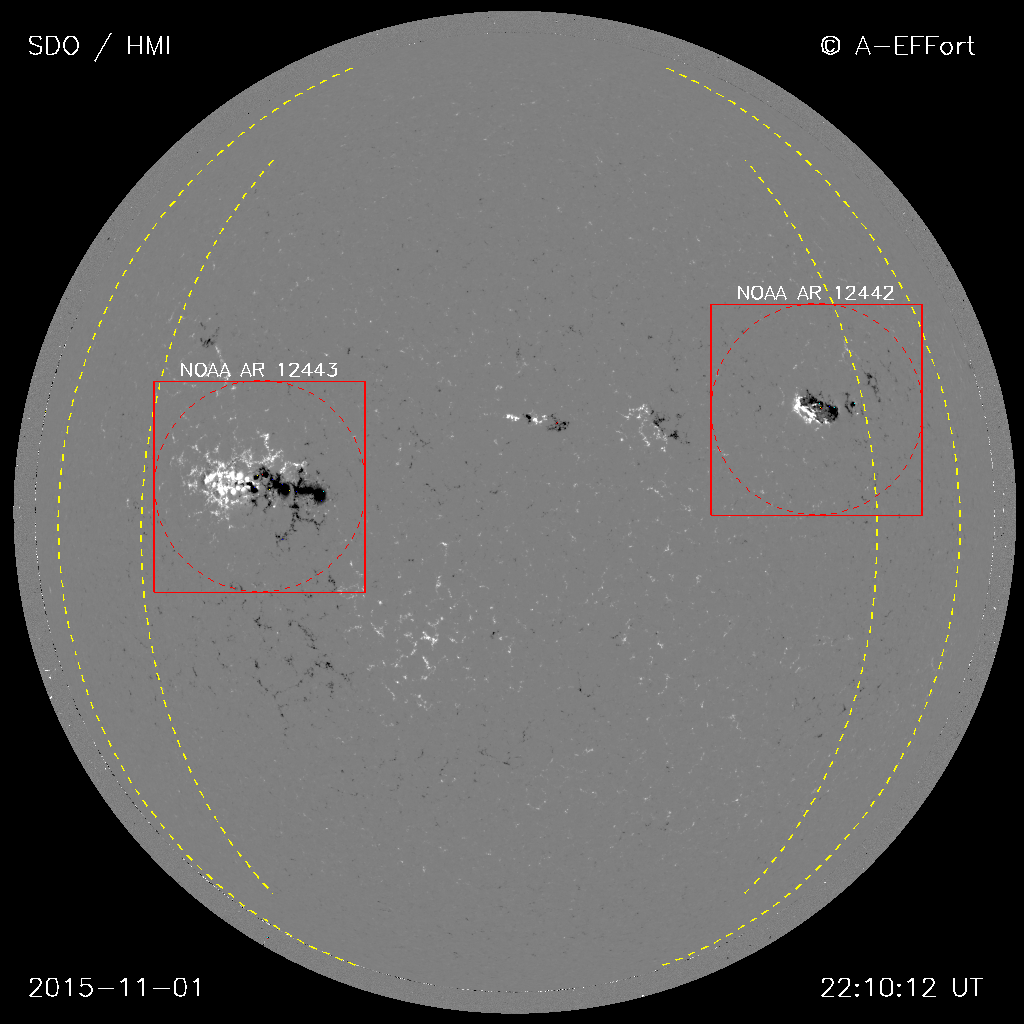 |
Eligible ARs where the Beff calculation will be performed are identified with the Active-Region Identification Algorithm (ARIA, Georgoulis et al. 2008) from the latest SDO/HMI full-disk LOS magnetogram. In brief, ARIA: a) smooths the magnetogram with a smoothing window of one supergranular diameter, b) co-aligns the smoothed intensity image with the initial LOS magnetogram to identify flux accumulations coinciding with certain image enhancements while discarding accumulations with a magnetic flux imbalance higher than a pre-set maximum-tolerance level, c) defines an intensity-weighted centroid (barycenter) for pinpointing on the solar sphere, d) outlines each intensity enhancement and crops the eligible AR region and e) assigns a NOAA AR number to each identified AR by matching its centroid location with NOAA’s SRS text, available from SWPC on the web. Dashed lines indicate the 50o to 70o EW Central Meridian Distances. |
Connectivity images
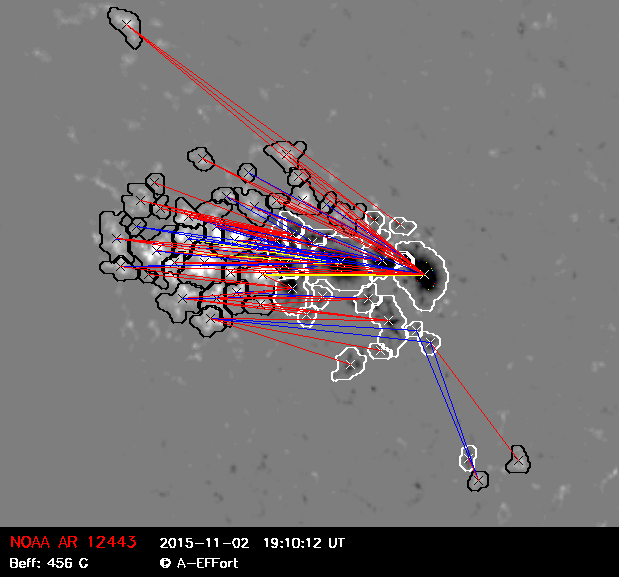 |
Eligible AR cutouts are first de-projected (Gary & Hagyard 1990) and then a flux-partitioning scheme translates the continuous flux distribution into a discrete collection of N+ and N- positive- and negative-polarity partitions, respectively, with known flux contents and topographical properties. With the three-dimensional field unknown, the [N+× N-] magnetic connectivity matrix Φij including fluxes committed to connections between a positive-polarity partition i and a negative-polarity partition j with a connection length Lij (distance between the locations of the flux-weighted centroids of the two considered partitions), is derived with a simulated annealing method (e.g., Metropolis et al. 1953; Press et al. 1992). This iterative technique defines connections between opposite-polarity flux partitions while globally minimizing the corresponding connection lengths within the FOV and provides the connectivity images of each eligible AR. Calculation of connectivity matrices is performed on the respective SOHO MDI-like magnetograms derived with a python translation script (courtesy of the HMI team). |
Beff value
With the connectivity matrix for an AR defined, its effective connected magnetic field strength Beff is given by:
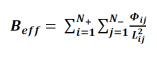
Calculation of Beff occurs up to 50o EW CMD, to avoid extreme projection effects. From 50o to 70o EW CMD a proxy of Beff is used, provided by the existing statistical association of the unsigned flux Φtot of the AR given by:

Flare probabilities for individual ARs
Cumulative flare probabilities, referring to a certain GOES flare class and above, for all identified ARs are derived from a statistical analysis of 55,691 SOHO/MDI magnetograms within ±30o CMD corresponding to 1416 ARs spanning over the entire solar cycle 23, and associated with 4574 flares comprising of 66 X-class, 623 M-class and 3885 C-class events. These conditional probabilities are given for any flare class and forecast window (here 24 hours) by a sigmoidal curve of the form
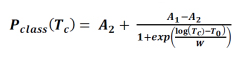
where A1, A2, T0 are known fitting coefficients, W is the weight of the sigmoidal function, and Tc is the normalized (with respect to the maximum Beff-value of the sample) Beff-threshold for different flare classes (M1, M5, X1 and X5 in our case).
Full-disk flare probabilities
If N ARs are present and Pfi (i=1, N) are the derived respective conditional probabilities for a given flare class f, the respective full-disk probability PFD for this flare class is given by
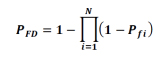
Downloadable ASCII file
This ASCII file contains all snapshot results of the A-EFFort service, including current alerts for the four GOES classes of interest, in textual form.
The read format of this downloadable ASCII text file is provided here and allows users to write a script in their programming language of preference for appropriate handling of the service results.
References
› Gary, G. A., Hagyard, M. J., 1990, Solar Phys., 126, 21 [NASA/ADS]
› Georgoulis, M. K. & Rust, D. M., 2007, Astrophys. J., 661, L109 [NASA/ADS]
› Georgoulis, M. K., 2011, In Proc. IAU Symp. 273 on the Physics of Sun and StarSpots (eds.: D. P. Choudhary, K. G. Strassmaier), IAU Symposium, 273, 495 [NASA/ADS]
› Georgoulis, M. K., 2013, Entropy, 15, 5022 [NASA/ADS]
› Georgoulis, M. K., Raouafi, N.-E., & Henney, C. J., 2008, In Subsurface and Atmospheric Influences on Solar Activity (eds.: R. Howe, R. W. Komm, K. S. Balasubramaniam, & G. J. D. Petrie), ASP Conf. Series, 383, 107 [NASA/ADS]
› Metropolis, N., Rosenbluth, A., Rosenbluth, M., Teller, A., Teller, E., 1953, J. Chem. Phys., 21(6), 1087 [NASA/ADS]
› Press, W. H., Teukolsky, S. A., Vetterlink, W. T., Flannery, B. P. 1992, Numerical Recipes: The Art of Scientific Computing (Cambridge University Press, New York) [NASA/ADS]
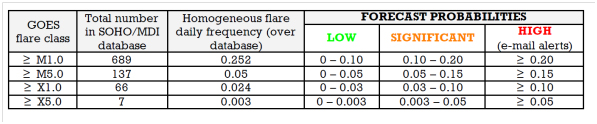
Performance verification of the A-EFFort flare-prediction method has been achieved using standard dichotomous (or categorical) and probabilistic validation techniques. Validation has been applied to the historical A-EFFort SOHO/MDI full-disk LOS magnetogram database, spanning between May 1996 and September 2006. In these magnetograms, ARIA has identified and extracted 55,691 magnetograms corresponding to 1,416 solar active regions. In a subset of these active regions over the above observing interval a number of 689 flares of GOES class ≥ M1, 137 flares of class ≥ M5, 66 flares of class ≥ X1, and 7 flares of class ≥ Χ5, were triggered.
To apply dichotomous and probabilistic validation practices we have defined different, random training and test subsets of the historical A-EFFort database. About 80% of the calendar days on which magnetograms exist has been used for training, with the remaining ~20% of calendar days used for testing. Analysis has been repeated 100 times on random training and test subsets to achieve reliable values and uncertainties (standard deviations) of the various skill metrics.
Dichotomous Validation
Dichotomous validation, where a YES/NO forecast applies rather than a probability, has been achieved by means of the classical 2 x 2 contingency table (Woodcock 1976). This table, shown below, includes hits a (i.e., events predicted and observed), false positives b (i.e., events predicted but not observed), misses c (i.e., events not predicted but observed), and true negatives d (i.e., events neither predicted nor observed).
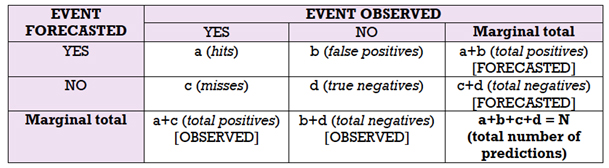
Key indices and skill scores can be inferred from the above table elements (see a detailed description of them at http://www.cawcr.gov.au/projects/verification). Among other possibilities we have investigated the so-called Heidke skill score (HSS) of Heidke (1926), given by

and the Hanssen & Kuipers (1965) discriminant, or true skill statistic (TSS; Bloomfield et al. 2012), given by
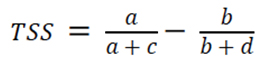
A zero HSS-value implies a random prediction while a perfect score is obtained for HSS=1 (no false positives and misses in this case). The same situation implies a perfect TSS=1. However, to implement a categorical validation into a probabilistic forecasting method, one needs to define a probability thresholds pthres, whose excess (p ≥ pthres) implies a YES and a NO is implied otherwise (p < pthres). For each pthres, different HSS and TSS are obtained. For the historical A-EFFort database and for the four GOES flares classes of interest, the curve HSS(pthres) is shown in the plot below:
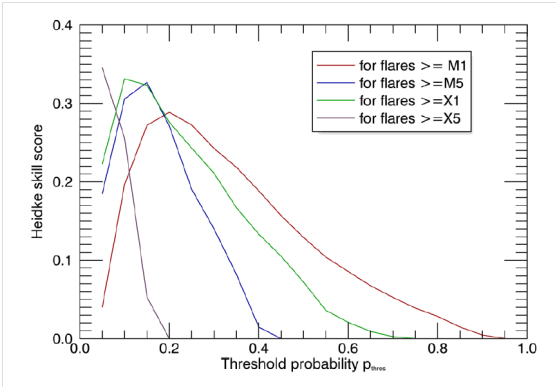
Clearly, the maximization of HSS implies the threshold probability pthres at which the probabilistic validation approaches as closely as possible a categorical one.
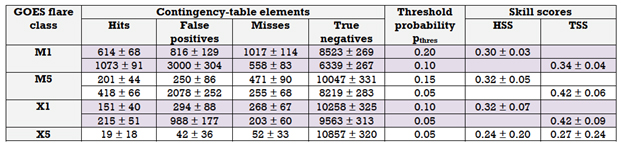
The best HSS- and TSS-values reached by this task, together with the respective pthres for HSS and TSS, are obtained in the table below:
Probabilistic Validation
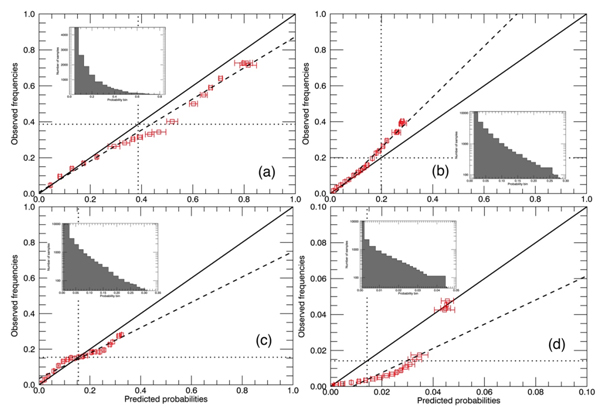
Probabilistic validation, where each forecast probability is counted by value, rather than certainty (YES/NO), has been achieved by means of the reliability or attribute diagram, implemented for the prediction of each flare class. In this diagram, one correlates the forecast probability p with the observed frequency o, achieving perfect score in case points on the diagram are distributed along the straight line p = o. More quantitatively, the skill score (SS) of Murphy & Epstein (1989) can be defined, namely
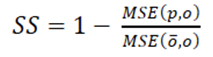
where MSE(p,o) is the mean square error between p and o, and ō is the mean value of o, defining the "climatology" limit, that is independent from p. Obviously a perfect SS=1 is achieved in case of the straight line p = o, while approaching the climatology limit (no skill), SS < 0. On the limit itself, where o = ō regardless of p, SS → − ∞.
The average SS-values achieved by the analysis are as follows:
- Flares of GOES class ≥ M1: SS = 0.88 ± 0.14 (97 / 100 tests counted)
- Flares of GOES class ≥ M5: SS = 0.78 ± 0.21 (81 / 100 tests counted)
- Flares of GOES class ≥ X1: SS = 0.80 ± 0.18 (78 / 100 tests counted)
- Flares of GOES class ≥ X5: SS = 0.38 ± 0.30 (24 / 100 tests counted)
Individual reliability plots for the tests giving SS-values best matching the above averages are given in the plots below (inset histograms correspond to the sample size used for each probability bin):
Email Alert Probabilities
As the A-EFFort service includes e-mail alerts for high probabilities for all flare classes of interest, we identify a high probability as the probability at which the HSS peaks (see plot above). This, and probabilities exceeding it, are colored red in the A-EFFort service webpage and trigger an e-mail alert, upon a user's registration for the particular flare class. From a zero probability up to an intermediate value between zero and the high-probability threshold, we identify probabilities as low and color them green in the A-EFFort service webpage. Probabilities between low and high are identified as significant and are colored orange in the A-EFFort web site. The distinction between low and significant probabilities depends on the specifics of the HSS(pthres) curve, as shown above. The following table outlines our selections for all GOES flare classes of interest in the A-EFFort service:
Preliminary A-EFFort service validation
The A-EFFort service itself was validated in a preliminary way for the first three (3) months of its operation, namely the period May – July 2015. A number of flares ≥ M1 were triggered in ARIA-identified active regions, while there were only two (2) flares ≥ M5 and no flares above X1. Therefore, validation practically involved flares of class ≥ M1, as the statistics were very poor for flares of classes ≥ M5. Only probabilistic validation was attempted, giving an SS ⋍ 0.85, quite consistent with the "expected" SS-value of 0.88 ± 0.14 obtained by the validation of the historical database. While this is only preliminary, it is evidently a positive sign for the performance of the service.
References
› Bloomfield, D. S., Higgins, P. A., McAteer, R. T. J., Gallagher, P. T., 2012, Astrophys. J., 747, L41 [link]
› Hanssen, A. W., Kuipers, W. J. A., 1965, Meded. Verh., 81, 2 [link]
› Heidke, P., 1926, Geogr. Ann. Stockh., 8, 301 [link]
› Murphy, A. H. & Epstein, E. S., 1989, Mon. Weather Rev., 117(3), 572 [link]
› Woodcock, F., 1976, Mon. Weather Rev., 104, 10 [link]